At the Apparatus jam, I made an electric field visualization.
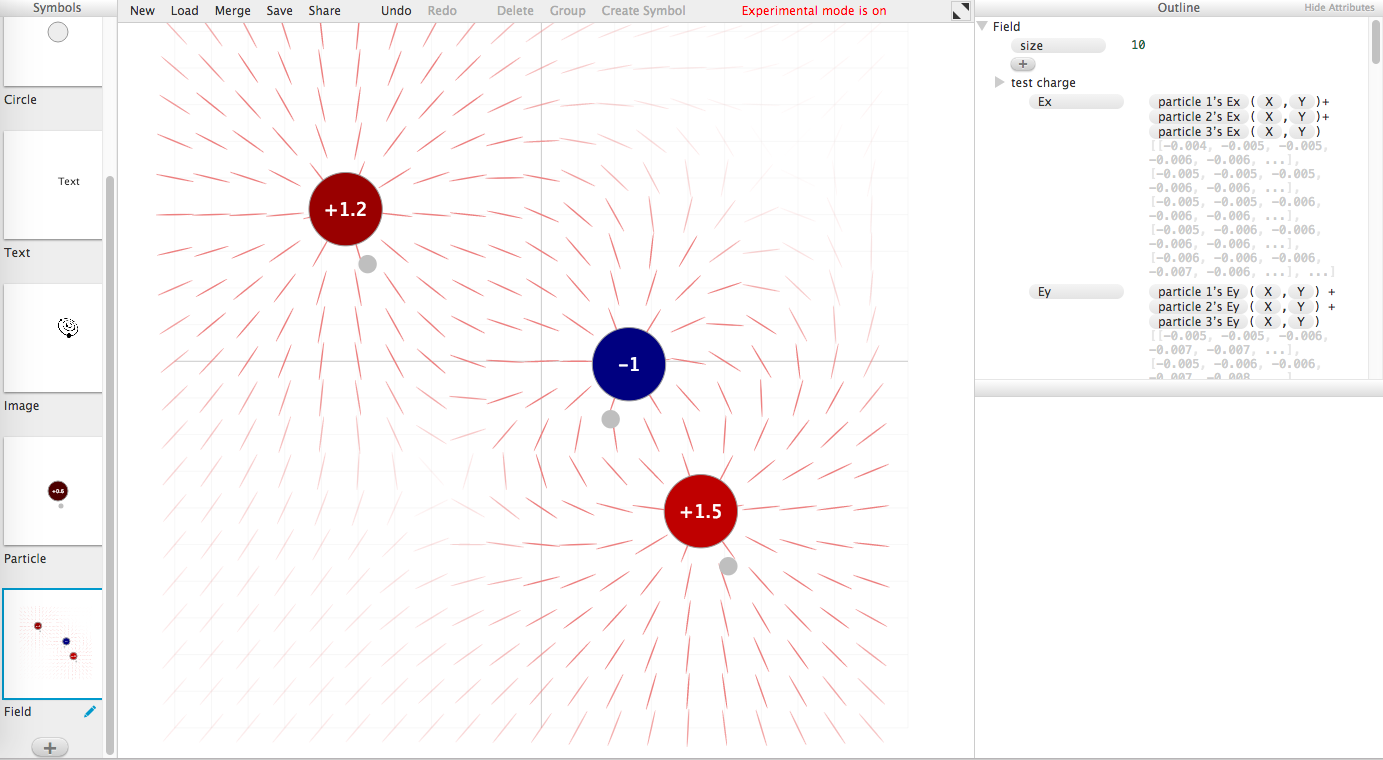
You can drag the particles around and adjust their charge. The field grid comes "for free" as a two-dimensional spread.
A couple things that I wanted to do but Apparatus doesn't currently support:
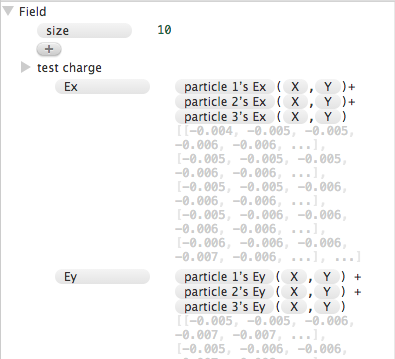
- I wanted to draw continuous field lines, instead of a grid of vectors. One way to do this is to drop a "turtle" and draw its trajectory through the field, which would require iteration or something like that.- I wanted to be able to drag in new particles from the symbols palette and have the field update accordingly. This would require Apparatus expressions which could refer to dynamic collections of objects ("sum of Ex of all of the particles in group G"). As is, the field expressions had to be hardcoded for the three particles on the canvas.
Something I thought I couldn't do, but I realized I could as I was writing this email:
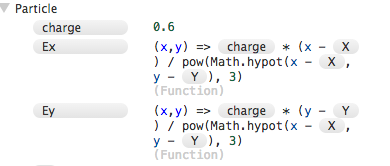
- I wanted to define a function E(x,y) on each particle that would take the (x,y) position of the grid point we're evaluating and return the field vector. Then we could just add up E(x,y) for each of the particles. Turns out that works just fine:
On Oct 3, 2016, at 12:58 PM, Toby Schachman wrote:Documentation from my project at the embedding jam:The idea is to make as much historical weather data (temperature, etc) available as possible to explore. I found this FTP site from the NOAA that has lots of data dumps from US observations:Of particular note, this text file has the station IDs and dates operational (though each station has holes within this range). This pdf has the data format. I wrote a lua script (attached) to parse out the date/time and temperature data. This gave me the hourly temperature in Oakland for a range of years.Here's a screenshot of the sketch I started,<image.png>Apparatus file attached. Also attaching the (compressed) data.json file I generated from the Lua script. In theory you can make the whole thing run by running server.py (attached) which is like python -m SimpleHTTPServer but does the CORS thing.The weird dip in temperature in the afternoon is (we think) because the timezone is probably some standard timezone, not the local time for the station, so that needs to be corrected.If I ever get back to this project, the goal is to show the current temperature in the current location--this is the weather here and now--and then let you "zoom out" from that to explore trends in weather (was it really this hot last September?) etc. Ideally the data visualization would be outside (like outdoors). I originally had this idea for an empty screen facing a window on the ground floor at the ITP building at 8th and Broadway in NYC where people occasionally put up things for pedestrians to see.Apparatus worked well enough for doing this exercise. It didn't choke on the 10mb json. It was nice to be able to rename variables without it being a thing, and reordering variables was key (did this a bunch as I figured out how I wanted to deal with the data).There was something a little awkward about having to refer to Apparatus variables to grab functions (e.g. pad), but that may be related to the general awkwardness of needing to "autocomplete" variable names when typing in order to bind to them.Getting the sliders in the right range also felt awkward, as was the fact that the scale for the temperature was arbitrary. Apparatus could use some feature analogous to D3's scales if we wanted to push the data viz use case further.--
************************
************************
<jsonify.lua><apparatus embedding jam - weather.json><server.py><data.json.zip>