I've been playing around a bit with trying to de-tiny-rectangularize plots of mathematical functions.
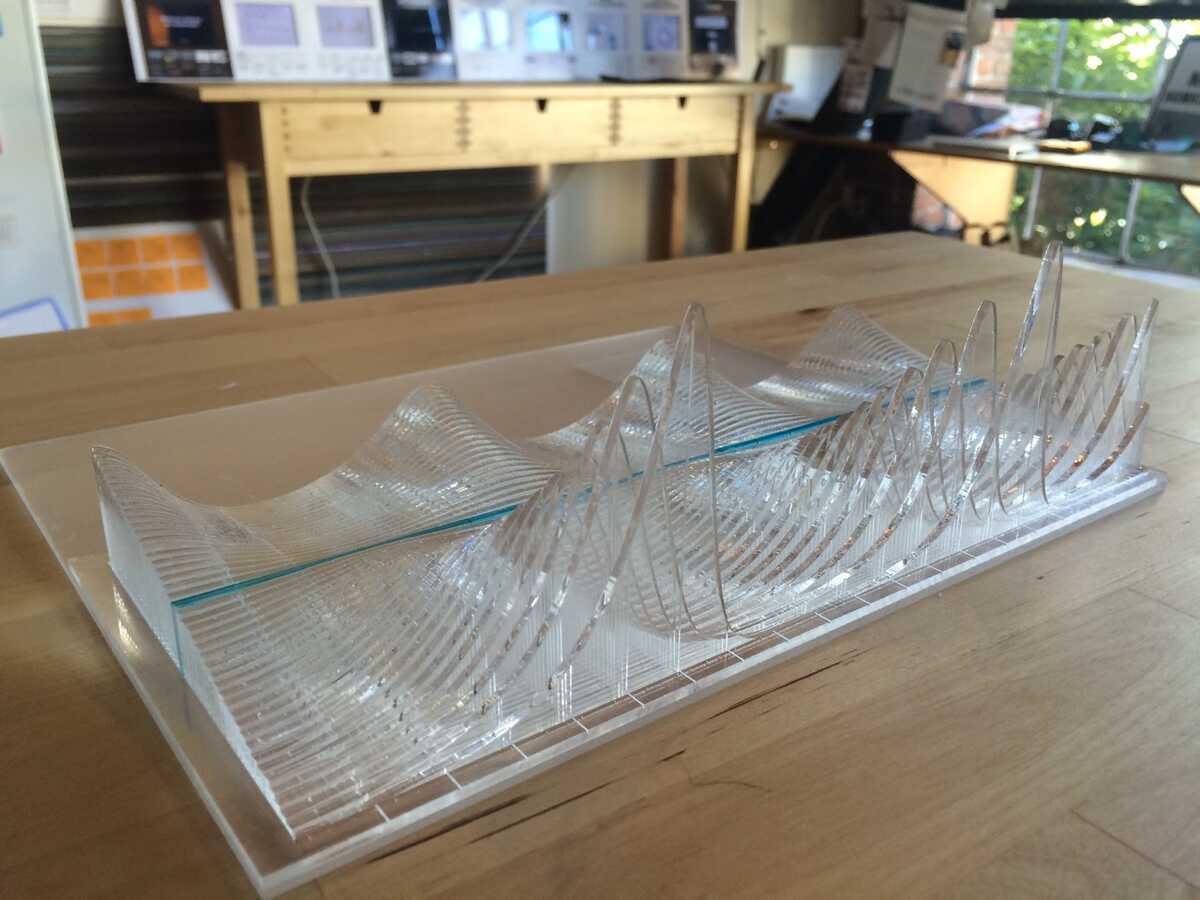
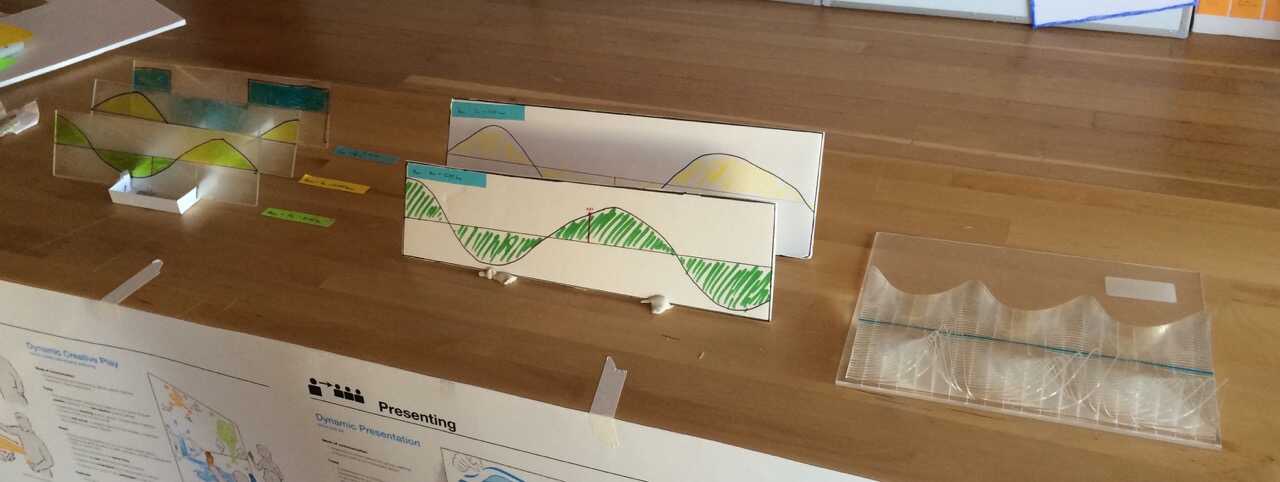
Here's a "sculpture" of the the response of the predator-prey system (with coefficients set to 1):
d prey / dt = prey - predators * prey
d predators / dt = -predators + predators * prey
Each slice shows the number of prey over time. The slices show the responses for different initial values of prey.
If you turn it sideways and look along the left edge, you can see the initial value is "swept" in a linear ramp:
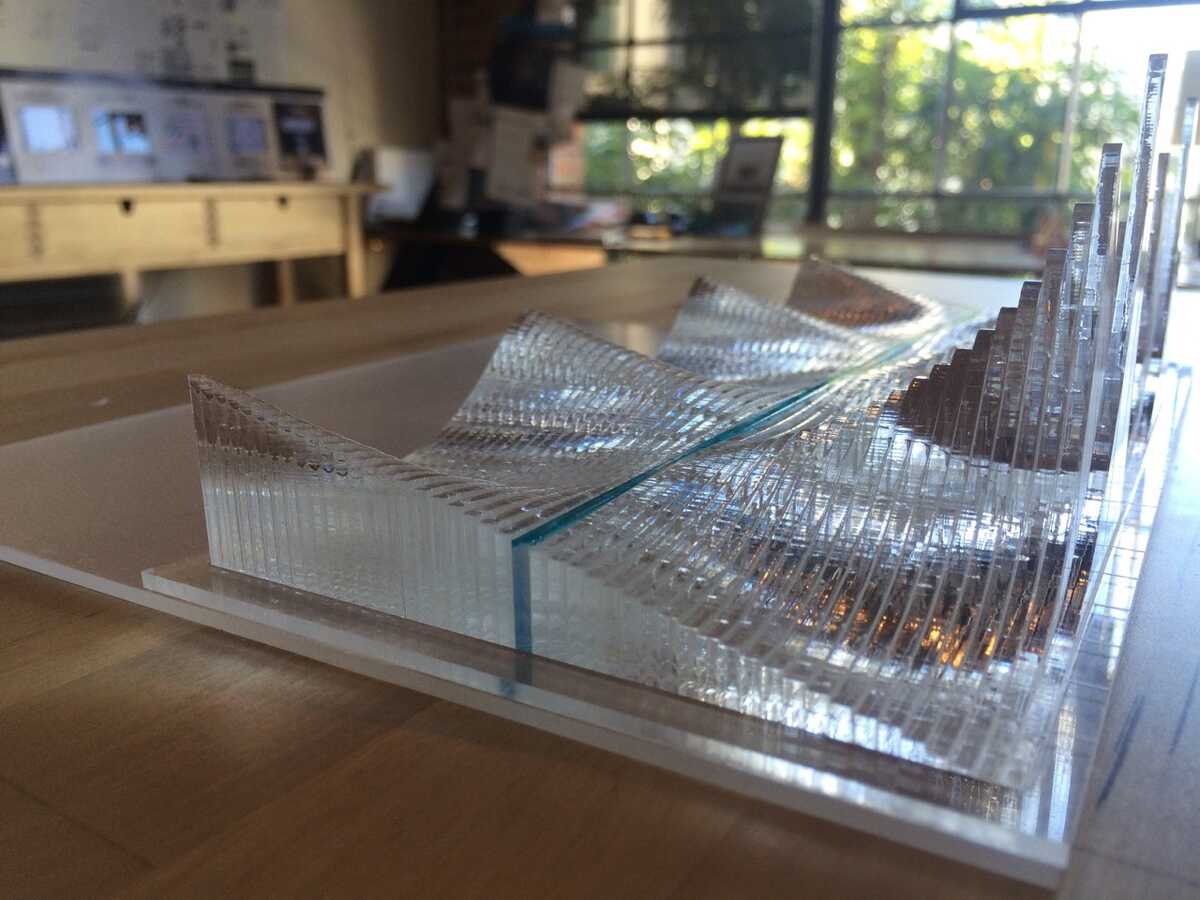
The fact that it's static sculpture (fixed for a particular parameter set) limits its direct usefulness, but it's not intended to be directly useful, so much as a "thing to think about". For example, how mathematical plotting might work on an inFORM-like tactile display.
Some of the things we were thinking about were:
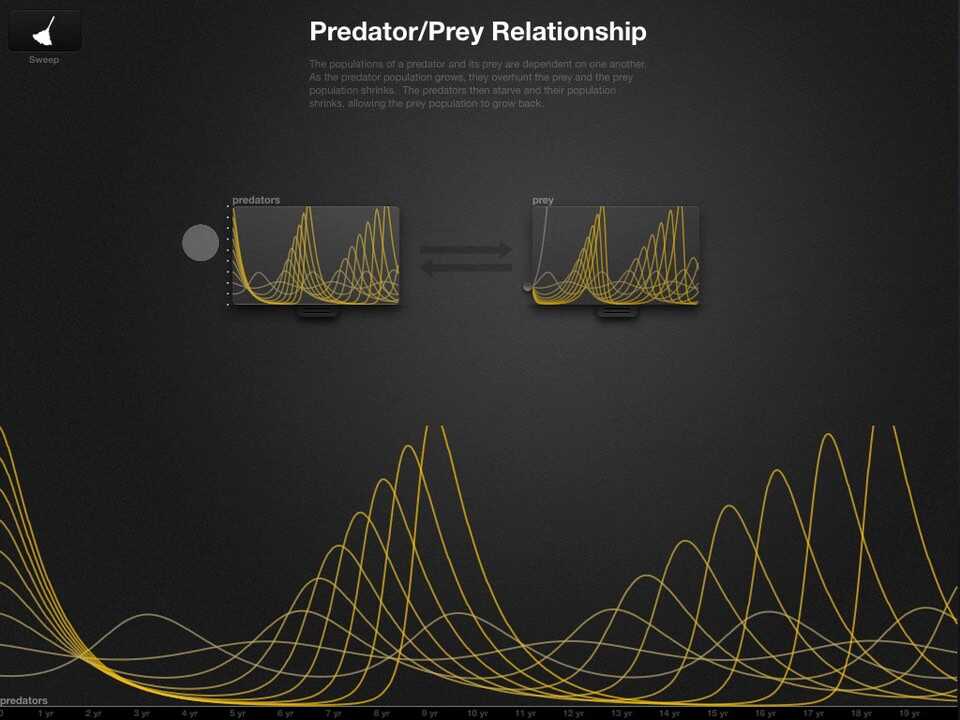
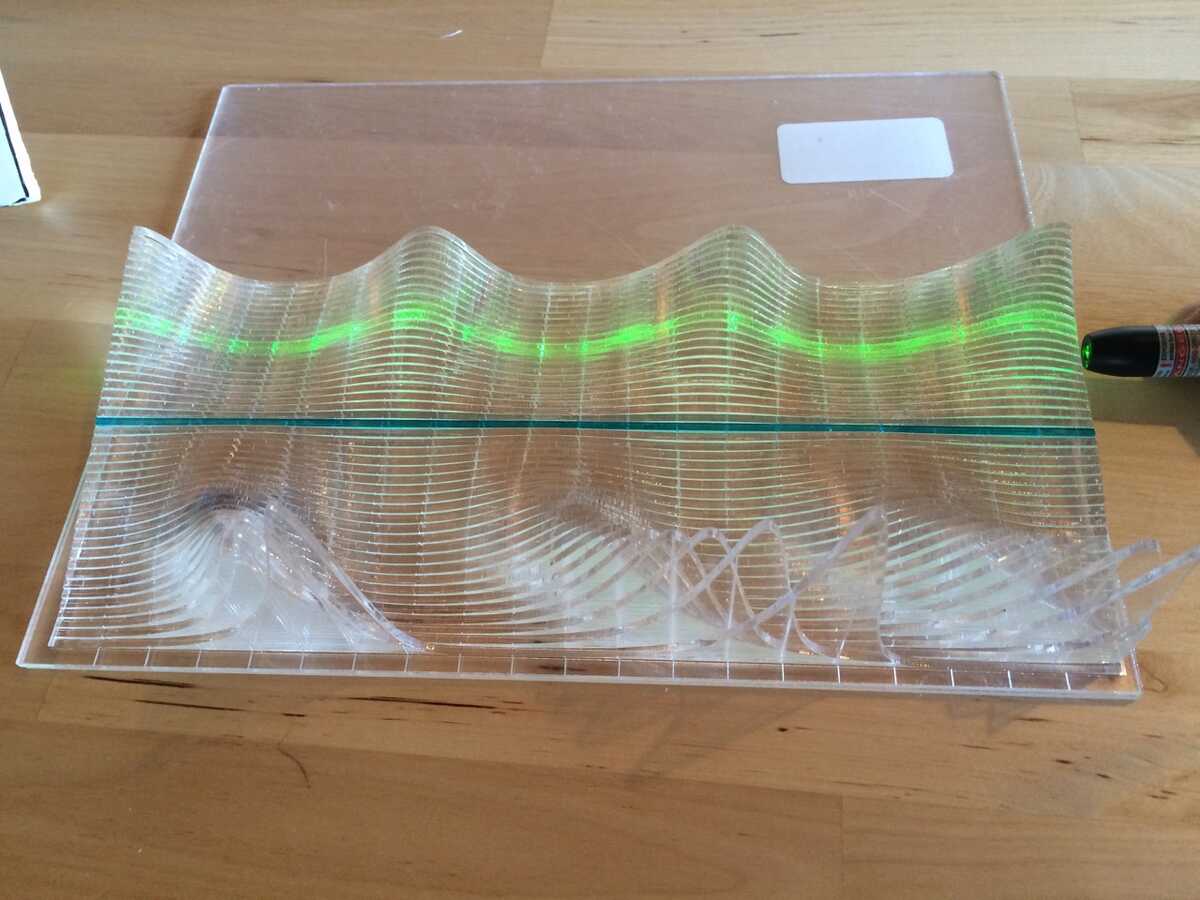
We noticed that you could shine a laser along the edge to highlight a particular slice, which was fun:- Is there a way to show both the predator and prey variables, and compare them? Are they separate sculptures, or interleaved, or one ascends up from the centerline and one descends down, etc?- How to compare the heights to a reference line (e.g., here the blue line is the equilibrium at prey = 1.) Now, you can only compare if you are staring head-on, and barely even then. A flat 2D plot is good at this sort of comparison -- I wonder if 3D plots could be made similarly good.- The fact that the plot is made of slices that you can pick up and slide out is an artifact of how it was fabricated, but it's an interesting action. We talked about being able to grab a slice out of the plot, and bring it over to a circuit or signal-processing system, in order to use the slice's signal as input to the system.- Phase-space trajectories (aka phase portraits) are generally more useful than time plots in understanding the dynamics of a system. I wonder what a "phase sculpture" might be like. (I have no idea right now.)
video: [IMG_8053.m4v]
Separately, I was wondering what Multitrack Signal Processing (
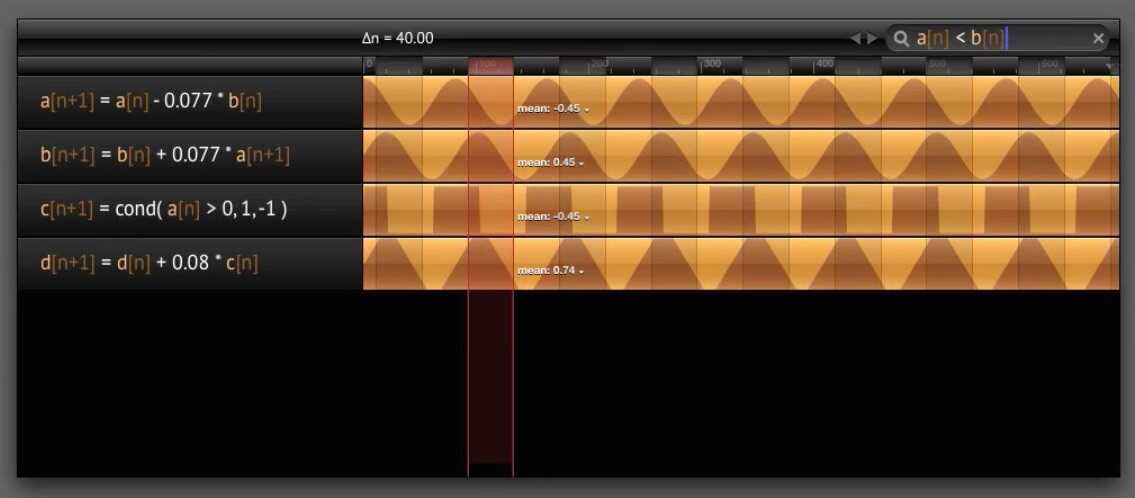
) would be like if I could get the tracks out of the tiny rectangle. An initial "diorama" mockup looked like this:
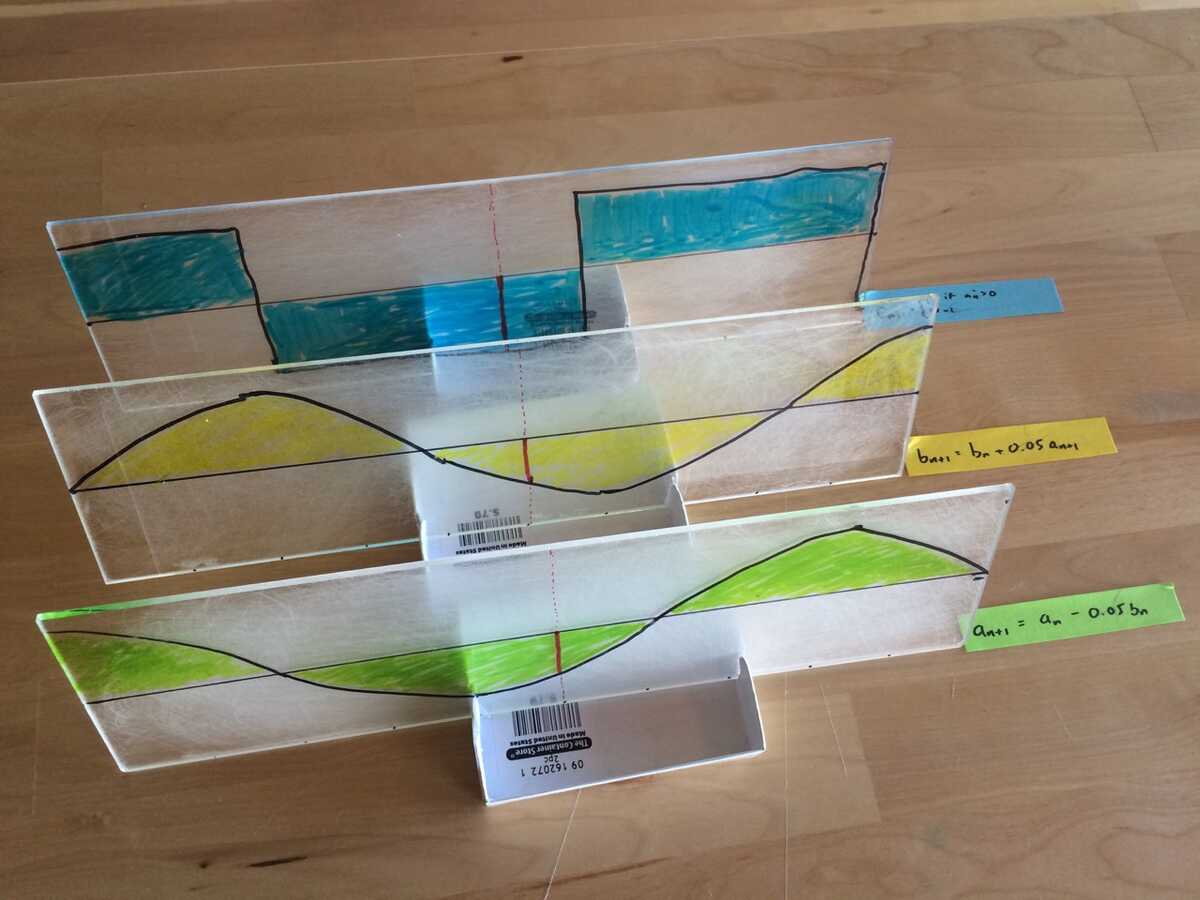
The tracks are "leaning back" at an angle.
At some point, I will probably make a working prototype using blank pieces of foam core and projecting onto them.
Playing with the mockup, a surprising good feeling came from writing the equations by hand, in pencil (in real mathematical notation, with subscripts etc.), and pretending like I was scrubbing numbers and connecting numbers using motions of the pencil. It felt so much better than typing ascii into a little box, and dragging pixels with a mouse. I still do math longhand, generally, on scrap paper, and this strongly evoked that -- the tactile sensation, the freedom to write anything anywhere, the freedom to put the scrap of paper anywhere -- and scrubbing by dragging the pencil on the number (or drawing a plot freehand, etc) felt like a very natural extension of that.