I've showed most of you this plot already, but I thought I'd send it out to the Dynamic Archive. See the attached video.
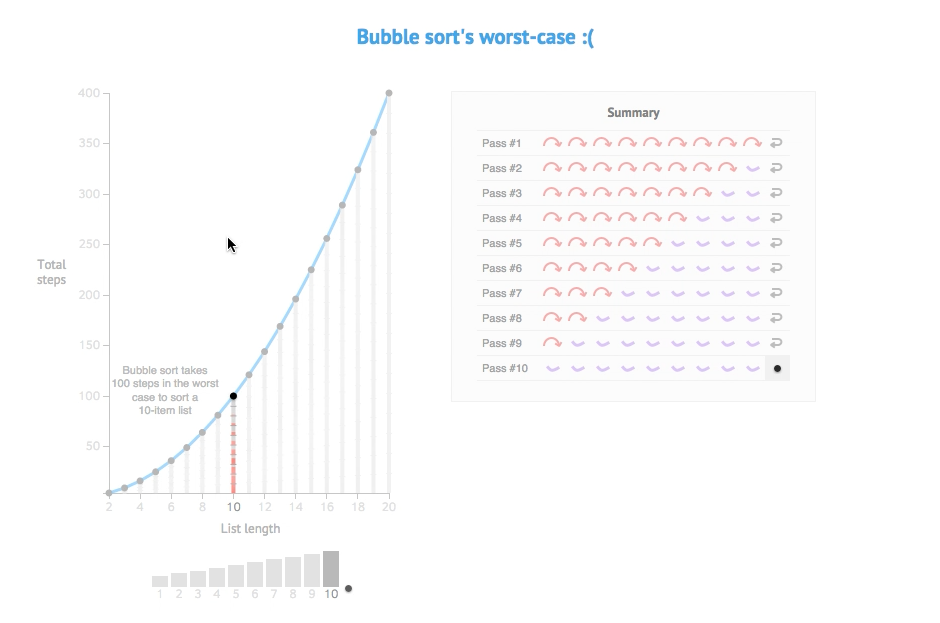
This diagram is the 6th and final part of the bubble sort explorable essay I've been doing. At this point, the reader is fairly familiar with the working of bubble sort on a concrete level. They've just solved a puzzle about finding the most number of steps bubble sort takes to complete for a single array of numbers, and are now ready to see this behavior abstracted and understand why this growing square can be a bad thing.
To me, this diagram feels really good because every pixel in the plot corresponds to a concrete state in a system. Everything is meaningful. The plot doesn't just magically appear, but is constructed very explicitly by stacking the steps up. There's also something nice about how information dense it is without feeling overwhelming.
Still lots to do elsewhere in the essay, but it's progress!